| Previous | Contents | Index |
The current maxima for the size of a journal are:
Number of blocks per disk: 524288
(This is max_segments_per_disk * disk_blocks_per_segment , or 16384 times 32.)
Number of disks per journal: 16.
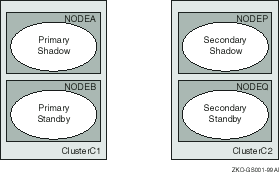
Shadowed sites can either be two nodes within a single cluster, or can be two separate clusters. In the second case you can also configure standby servers on one or more of the other cluster members, so that failure of a single node within one of the shadow sites does not stop the shadow site from functioning. Multiple concurrent copies of the server processes are allowed on each site (see Figure 5-1).
Standby servers can also be configured on nodes that are not in the same cluster, but RTR does not guarantee transaction failover in this case. Some operating systems provide full cluster capability in which, when one node fails, access to disks managed by that node is contained automatically. Operating systems that do not have this capability can achieve a similar result with dual-ported disks if set up to enable this access. See Section 2.16.2 for more details. |
Figure 5-1 Four Node Shadow/Standby Configuration

The performance of a shadow pair compares with a transaction that spans two nodes, with the addition of one extra protocol message which is required to ensure that the transactions are presented in the same order.
RTR does not have to wait for the secondary shadow server to complete its processing. It only needs to know that the primary has committed the transaction and that the journal file of the secondary shadow server contains the final vote status.
The two partners in a shadow pair should be connected with sufficient
bandwidth to allow for the large amounts of data which may need to be
transferred during a shadow catchup operation.
5.7 Shadows in Action
The first node on which a shadow backend for a particular key range starts is arbitrarily designated by RTR to be the primary site for that key range.
Initially RTR searches the journals of other backend nodes to find any recoverable transactions left over from a previous invocation of the backend. Once these have been processed (or RTR determines that no such transactions exist), the backend becomes active and available to handle new transactions sent by clients/frontends.
While no other backend node for this key range is available, the backend runs in REMEMBER mode. RTR saves transactions processed on this site in the RTR journal (together with the order in which they should be committed), so that when the other-site backends start, they can be sent to this site.
When a backend starts on a second site, it begins processing the transactions saved in the primary site's journal. These are deleted from the journal as they are processed. When the second site backends have caught up, the second backend enters SECONDARY ACTIVE state and the original site backends enter PRIMARY ACTIVE state. In this mode, new transactions are sent to both sites in parallel. They are executed first on the primary site, and shortly afterward on the secondary site in the same order. The primary site commits transactions as soon as it knows that the secondary site has hardened (i.e., written to the journal) the order in which the transaction is to be committed.
If a failure occurs at this point, the remaining site executes a short cleanup operation. After completing the cleanup operation and determining that the other site is really down, it reverts to the REMEMBER state and continues processing new transactions autonomously, saving the transaction information in its journal for when the other site restarts.
The execution order is determined for transactions issued to concurrent
servers on a particular node by recording the order in which the
individual servers issue
rtr_accept_tx()
calls. RTR knows that at the time a correctly written server
application calls
rtr_accept_tx()
, it has already accessed (and therefore locked) any database records
it uses, and that it will release these records after RTR causes the
rtr_accept_tx()
call to complete. Any conflicting transaction would not be able to issue
rtr_accept_tx()
concurrently. Therefore a correct serialization order for issuing the
transactions on the shadow site can be determined.
5.8 Application Considerations
Although applications need not be directly concerned about shadowing matters, certain points must be considered when implementing performance boosting optimizations:
For more information on designing applications, see the Design for
Tolerating Site Disaster section in the RTR Application Design
Guide.
5.9 Server States
The current state of a server can be examined as follows:
RTR> show server/full Servers: Process-id: 13340 Facility: RTR$DEFAULT_FACILITY Channel: 131073 Flags: SRV State: active Low Bound: High Bound: 87 13 rcpnam: "RTR$DEFAULT_CHANNEL" User Events: 0 RTR Events: 0 Partition-Id: 16777216 Process-id: 13340 Facility: RTR$DEFAULT_FACILITY Channel: 196610 Flags: SRV State: active Low Bound: 88 13 High Bound: 0f' rcpnam: "CHAN2" User Events: 0 RTR Events: 0 Partition-Id: 16777217 |
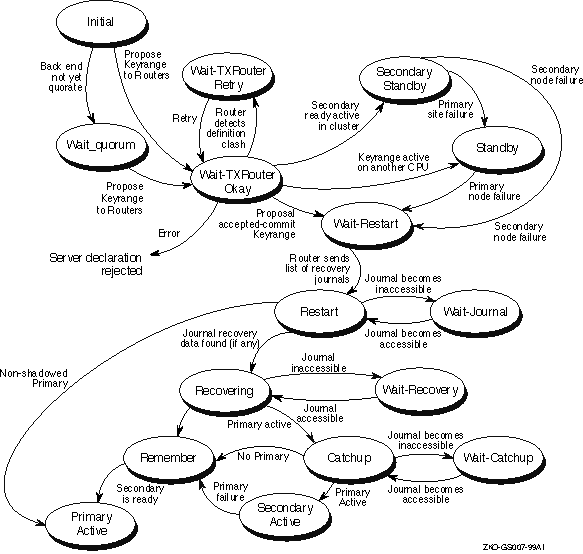
Figure 5-2 gives an overview of the server state changes which appear in the State: field.
Figure 5-2 Backend Server States

5.10 Client States
The current state of a client process can be examined as follows:
RTR> show client/full Clients: Process-id: 13340 Facility: RTR$DEFAULT_FACILITY Channel: 458755 Flags: CLI State: declared rcpnam: "CHAN3" User Events: 255 RTR Events: 0 |
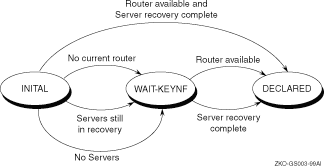
Figure 5-3 describes the client state changes which appear in the State: field.
Figure 5-3 Frontend Client States

5.11 Partition States
The current state of a key range partition can be examined using the
SHOW PARTITION/FULL command for the routers and the backends:
RTR> show partition/router/full Facility: RTR$DEFAULT_FACILITY State: ACTIVE Low Bound: 0 High Bound: 4294967295 Failover policy: fail_to_standby Backends: node10 States: active Primary Main: node10 Shadow Main: |
Backend partitions:
RTR> show partition/backend/full Partition name: RTR$DEFAULT_PARTITION_16777217 Facility: RTR$DEFAULT_FACILITY State: active Low Bound: "aaaa" High Bound: "mmmm" Active Servers: 0 Free Servers: 1 Transaction presentation: active Last Rcvy BE: Txns Active: 0 Txns Rcvrd: 0 Failover policy: fail_to_standby Key range ID: 16777217 Partition name: RTR$DEFAULT_PARTITION_16777218 Facility: RTR$DEFAULT_FACILITY State: active Low Bound: "nnnn" High Bound: "zzzz" Active Servers: 0 Free Servers: 1 Transaction presentation: active Last Rcvy BE: Txns Active: 0 Txns Rcvrd: 0 Failover policy: fail_to_standby Key range ID: 16777218 |
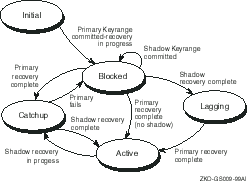
Figure 5-4 describes the partition state changes which appear in the State: field.
Figure 5-4 Router Partition States

This chapter contains a description of the RTR monitor. The RTR monitor allows you to view the activities of RTR and your applications. Many different aspects of RTR's behavior can be viewed, allowing the activities and performance of RTR to be analyzed.
6.1 Introduction
The RTR monitor provides a means to continuously display the status of
RTR and the applications using it.
It can be used to check the correct operation of an RTR network, showing information useful for tuning, capacity planning, and locating configuration and application errors.
The information displayed is composed of named data items which are continuously updated by RTR. These data items can be displayed in various formats and combined using simple arithmetic operators and constants.
The monitor is invoked with the MONITOR command. MONITOR displays a monitor picture that is periodically updated. See Section 7.2 for the full syntax of the MONITOR command.
A monitor picture contains elements that are either text (such as labels and titles) or variables derived from data items. Monitor pictures can be defined either interactively at the RTR> prompt or defined in a file called a monitor file.
You can use monitor files provided with RTR and you can create your
own. See Appendix A for information about creating monitor files.
6.2 Standard Monitor Pictures
A number of standard monitor pictures are supplied with RTR. These cover most of the usual monitoring requirements. You may define your own monitor pictures or alter the standard ones to suit your particular needs. Table 6-1 contains a list of the standard monitor pictures. To display one of these pictures, use the following command at the RTR prompt:
RTR> MONITOR picture-name |
The files for standard monitor pictures are installed on your system when RTR is installed. The location of these files is platform specific. The file names are the picture name appended with .mon . Type the file name without .mon when starting the display.
See Chapter 7, RTR Commands, for more information on the MONITOR command.
| Picture name | Description |
|---|---|
| accfail | Shows link transport name for links on which a connection attempt was declined, with a reason for failure. The most recent entry is highlighted. |
| acp2app | Displays counts of messages and number of bytes from RTRACP to the application, as viewed from a specific node. |
| active | Displays a list of RTR processes, and for each process the number of transactions they have started, the number of transactions they have completed and the number of transactions that are still active. |
| app2acp | Displays counts of messages and number of bytes from the application to RTRACP, as viewed from a specific node. |
| appdelay | Displays counts of flow-control induced traffic stalls by application process. |
| broadcast | Displays information about RTR user events by process, including number of user events enqueued, received, and discarded. |
| calls | Displays the total number of RTR API calls and their success or failure for the processes on all the nodes being monitored. All RTR messages are also shown by message type. (Pending messages are those that an application has not received yet). Use the /IDENTIFICATION=process-id qualifier to display the values for one specific process, otherwise the total values for all processes are displayed. |
| channel | Displays the roles of the channels declared by an application. This can be useful as a debugging tool in the early stages of application development. |
| connects | Displays connection status summary, including the number of links up and down, and a list of links with state (up or down), architecture, network transport, and fail-reason, if any. |
| ctccalls | Displays the history of calls for a specific client transaction controller. |
| downstream | Displays counts of downstream flow-control induced traffic stalls. |
| event | Displays event routing data by facility. Information includes events in transit and destination information showing number of events enqueued, processed, and discarded. |
| flow | Displays the flow control counters. |
| flostalls | Displays counts of flow-control induced traffic stalls. |
| frontend | Displays frontend status and counts by node and facility, including frontend state current router, reject status, retry count, and quorum rejects. |
| group | Shows server and transaction concurrency on a partition basis. |
| ipc | Shows counts of interprocess communication (IPC) activity in the RTR ACP and active RTR applications. |
| ipcrate | Displays rate information on IPC messages, byte counts, and I/O primitive usage. |
| journal | Displays the current journal usage on a node. Local node journal statistics are provided, and data for non local journals accessed from the local node. Includes statistics covering total number of entries and records written, the number of records read, and how many bytes were involved. Bar graphs showing current usage of journal blocks (as a percentage of the total) are also provided. |
| link | Displays a number of per-link data items. Use the /LINK=link-name qualifier to display the values for one specific link, otherwise the total values for all links are displayed. |
| netbytes | Displays a list of the links to other nodes. For each link, the total number of bytes received and sent on that link and the number of bytes received and sent per second are displayed. |
| netstat | Displays for each link the connection status in detail, with the link state (up or down), and architecture type of remote node (such as VAX, I386, Alpha, and so on). |
| ortr | Displays a list of server/client transaction controllers. |
| partit | Displays the status of server partitions. Shows the partition identifiers, key ranges and key segments, and the status of the servers (active, recovering and so on). |
| queues | Shows transaction queues on a partition basis. |
| quorum | Tracks (by facility) the configuration, reachability, and quorum status of one or more nodes. |
| recovery | Displays the status of server recovery procedures, such as waiting for quorum, catching up transactions, and so on. |
| rejects | Displays the last rtr_mt_rejected message received by each running process. |
| rejhist | Displays the last 10 rtr_mt_rejected messages received by the selected process. |
| response | Displays the elapsed time that a transaction has been active on the opened channels of a process. |
| rolequor | Displays a detailed picture of the various data items in the QUORUM picture, separated by roles. If a quorum problem is encountered, this picture may be useful for problem diagnosis. |
| routers | Displays information on a router node. It gives an indication of the utilization of the router in terms of transactions and broadcasts routed through this node. Useful to monitor performance or locate problems. |
| routing | Displays statistics of transaction and broadcast traffic by facility. |
| rscbe | Displays the most recent call's history for the RSC subsystem on a backend node. |
| stalls | Displays in real time any network links currently stalling in their outbound traffic, and provides a history of the stalls that the various links encountered during their lifetime. |
| stccalls | Displays a history of calls for a specified server transaction controller. |
| system | Displays the state of critical resources within the RTR environment. If a resource has exceeded a predefined threshold, a warning indicator is displayed. |
| tps | Displays the rate of transaction commits performed by each process using RTR. |
| tpslo | Displays low end of the rate of transaction commits performed by each process using RTR. |
| traffic | Displays a list of the links to other nodes. Shown for each link are: byte rate, packet rate, message rate and congestion, in both directions. Average packets per second is also shown. |
| trans | Displays transactions for a frontend, router and backend. |
| upstream | Displays upstream flow-control induced traffic stalls. |
| v2calls | Shows RTR Version 2 verb usage through the interoperability subsystem. The screen layout is identical to the RTR Version 2 Monitor Call's picture. |
| xa | Displays XA counter information including success and failure as well as call and read-only counters. |
The following sections describe the more commonly used standard monitor
pictures in detail.
6.2.1 Monitor Accfail (Link Acceptance Failures)
When configuring RTR, nodes can sometimes fail to connect up. Although the cause of the error can be viewed on the initiator side with the MONITOR NETSTAT picture, it can be difficult to pinpoint the problem when looking at the other end of the link. Use the MONITOR ACCFAIL picture to display the reason for the local node's refusal to accept connections.
================================================================================
                     U n a c c e p t a b l e    L i n k s

         Most recent links on which a connection attempt was declined

            Node: NODE11                Wed Jan  7 1998 10:51:00

--------------------------------------------------------------------------------
Link Transport Name(s)                  Reason for failure
--------------------------------------------------------------------------------
nodef                                   node is not configured for the facility
marke.zko.dec.com                       node not recognized
real1                                   facility name not matched
MARKE DEC:.ZKO.MARKE                    node not recognized
nodef                                   node is not configured for the facility
marke.zko.dec.com                       node not recognized
real1                                   facility name not matched
nodez                                   node role definitions do not match for
real1                                   facility name not matched
MARKE DEC:.ZKO.MARKE                    node not recognized
--------------------------------------------------------------------------------

         List entries are reused in a cyclical fashion; the most
         recent entry is highlighted.

================================================================================
|
Some errors that can be displayed by ACCFAIL include:
| Previous | Next | Contents | Index |