![[OpenVMS documentation]](../../images/openvms_doc_banner_top.gif)
|
![[Site home]](../../images/buttons/bn_site_home_off.gif)
![[Send comments]](../../images/buttons/bn_comments_off.gif)
![[Help with this site]](../../images/buttons/bn_site_help_off.gif)
![[How to order documentation]](../../images/buttons/bn_order_docs_off.gif)
![[OpenVMS site]](../../images/buttons/bn_openvms_off.gif)
![[Compaq site]](../../images/buttons/bn_compaq_off.gif)
|
| Updated: 11 December 1998 |
OpenVMS Debugger Manual
| Previous | Contents | Index |
The debugger provides the following predefined displays that you can use to capture and display different kinds of data:
When you enter screen mode, the debugger puts SRC in the top half of the screen, PROMPT in the bottom sixth, and OUT between SRC and PROMPT, as shown in Figure 7-1. Displays INST, REG, FREG (Alpha only), and IREG are initially removed from the screen by default.
To re-create this default configuration, press BLUE MINUS on the keypad (PF4 followed by the MINUS (--) key).
The basic features of the predefined displays are described in the next sections. As explained in other parts of this chapter, you can change certain characteristics of these displays, such as the buffer size or display attributes. You can also create additional displays similar to the predefined displays.
To display summary information about the characteristics of any display, use the SHOW DISPLAY command.
Table 7-1 summarizes key information about the predefined displays.
| Display Name | Display Kind | Valid Display Attributes | Visible on Startup |
|---|---|---|---|
| SRC | Source |
Scroll
Source (By Default) |
X |
| OUT | Output |
Error
Input Output (By Default) Scroll |
X |
| PROMPT | Output |
Error (By Default)
Output Program (By Default) Prompt (By Default) Scroll 1 |
X |
| INST | Instruction |
Instruction
Scroll |
|
| REG | Register | Scroll | |
| FREG (Alpha only) | Register | Scroll | |
| IREG | Register | Scroll |
See Chapter 6 for information about how to make source code available for display during a debugging session. |
The predefined display SRC (see Figure 7-1) is an automatically updated source display.
You can use SRC to display source code in two basic ways:
The name of the module whose source code is displayed is shown at the right of the display name, SRC. The numbers displayed at the left of the source code are the compiler-generated line numbers, as they might appear in a compiler-generated listing file.
As you execute the program under debugger control, SRC is automatically updated whenever execution is paused. The arrow in the leftmost column indicates the source line to be executed next. Specifically, execution is paused at the first instruction associated with that source line. Thus, the line indicated by the arrow corresponds to the current program counter (PC) value. The PC is a register that contains the memory address of the next instruction to be executed.
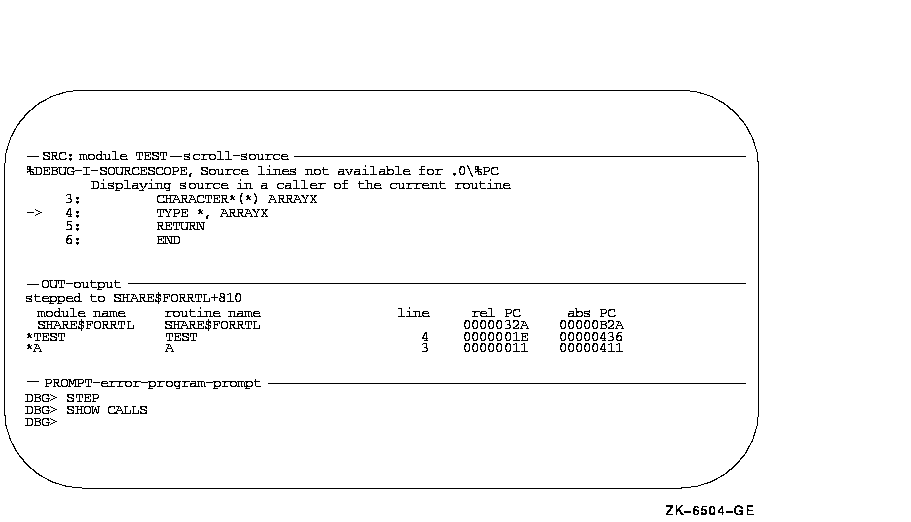
If the debugger cannot locate source code for the routine in which execution is paused (because, for example, the routine is a run-time library routine), it tries to display source code in the next routine down on the call stack for which source code is available. When displaying source code for such a routine, the debugger issues the following message:
%DEBUG-I-SOURCESCOPE, Source lines not available for .0\%PC.
        Displaying source in a caller of the current routine.
|
Figure 7-2 shows this feature. The source display shows that a call to routine TYPE is currently active. TYPE corresponds to a Fortran run-time library procedure. No source code is available for that routine, so the debugger displays the source code of the calling routine. The output of a SHOW CALLS command, shown in the output display, identifies the routine where execution is paused and the call sequence leading to that routine.
In such cases, the arrow in the source window identifies the line to which execution returns after the routine call. Depending on the source language and coding style, this might be the line that contains the call statement or the next line.
Figure 7-2 Screen Mode Source Display When Source Code Is Not Available

If your program was optimized during compilation, the source code displayed in SRC might not always represent the code that is actually executing. The predefined instruction display INST is useful in such cases, because it shows the exact instructions that are executing (see Section 7.4.4).
The built-in command that automatically updates display SRC is EXAMINE/SOURCE .%SOURCE_SCOPE\%PC. For information about the EXAMINE/SOURCE command, see Section 6.4. The built-in debugger symbol %SOURCE_SCOPE denotes a scope and has the following properties:
You can use display SRC to display source code throughout your program, if source code is available for display:
After manipulating the contents of display SRC, you can redisplay the
location at which execution is currently paused (the default behavior
of SRC) by pressing KP5.
7.4.1.2 Displaying Source Code for a Routine on the Call Stack
The command SET SCOPE/CURRENT lets you display the source code for any routine that is currently on the call stack. For example, the following command updates display SRC so that it shows the source code for the caller of the routine in which execution is currently paused:
DBG> SET SCOPE/CURRENT 1 |
To reset the default scope for displaying source code, enter the
command CANCEL SCOPE. The command causes display SRC to show the source
code for the routine at the top of the call stack where execution is
paused.
7.4.2 Predefined Output Display (OUT)
Figure 7-1 and Figure 7-2 show some typical debugger output in the predefined display OUT.
Display OUT is a general-purpose output display. By default, OUT has the output attribute so it displays any debugger output that is not directed to the source display SRC or the instruction display INST. For example, if display INST is not displayed or does not have the instruction attribute, any output that would otherwise update display INST is shown in display OUT.
By default, OUT does not display debugger diagnostic messages (these appear in the PROMPT display). You can assign display attributes to OUT so that it captures debugger input and diagnostics as well as normal output (see Section 7.3).
By default, the memory buffer associated with predefined display OUT
contains 100 lines.
7.4.3 Predefined Prompt Display (PROMPT)
The predefined display PROMPT is the display in which the debugger prompts for input. Figure 7-1 and Figure 7-2 show PROMPT in its default location, the bottom sixth of the screen.
By default, PROMPT has the prompt attribute. In addition, PROMPT also has (by default) the program and error attributes, which force program output and diagnostic messages to that display.
PROMPT has different properties and restrictions than other displays. This is to eliminate possible confusion when manipulating that display:
The debugger alerts you if you try to move or expand a display such
that it is hidden by PROMPT.
7.4.4 Predefined Instruction Display (INST)
By default, the predefined instruction display INST is not shown on the screen and does not have the instruction attribute (see Section 7.4.4.1 and Section 7.4.4.2). |
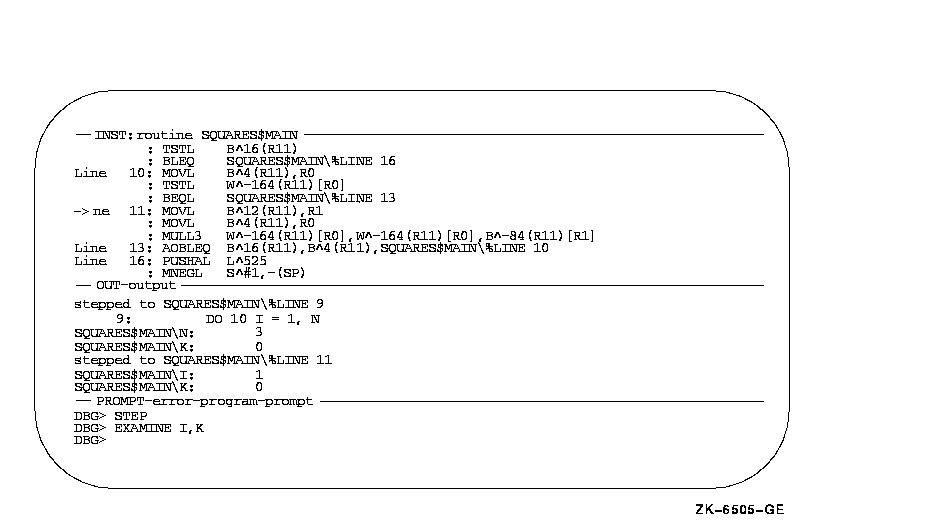
Display INST is an automatically updated instruction display. It shows the decoded instruction stream of your program. This is the exact code that is executing, including the effects of any compiler optimization.
A VAX example is shown in Figure 7-3.
This type of display is useful when debugging code that has been optimized. In such cases some of the code being executed might not match the source code that is shown in a source display. See Section 14.1 for information about the effects of optimization.
You can use INST in two basic ways:
The name of the routine whose instructions are displayed is shown at the right of the display name, INST. The numbers displayed at the left of the instructions are the compiler-generated source line numbers.
As you execute the program under debugger control, INST is updated automatically whenever execution is paused. The arrow in the leftmost column points to the instruction at which execution is paused. This is the instruction that will be executed next and whose address is the current PC value.
Figure 7-3 Screen Mode Instruction Display (VAX Example)

The built-in command that automatically updates display INST is EXAMINE/INSTRUCTION .%INST_SCOPE\%PC. For information about the EXAMINE/INSTRUCTION command, see Section 4.3.1. The built-in debugger symbol %INST_SCOPE denotes a scope and has the following properties:
By default, display INST is marked as removed (see Section 7.5.2) from the display pasteboard and is not visible. To show display INST, use one of the following methods:
You can use display INST to display decoded instructions throughout your program as follows:
After manipulating the contents of display INST, you can redisplay the
location at which execution is currently paused (the default behavior
of INST) by pressing KP5.
7.4.4.3 Displaying Instructions for a Routine on the Call Stack
The SET SCOPE/CURRENT command lets you display the instructions for any routine that is currently on the call stack. For example, the following command updates display INST so that it shows the instructions for the caller of the routine in which execution is currently paused:
DBG> SET SCOPE/CURRENT 1 |
To reset the default scope for displaying instructions, enter the
CANCEL SCOPE command. The command causes display INST to show the
instructions for the routine at the top of the call stack where
execution is paused.
7.4.5 Predefined Register Displays (REG, IREG, and FREG)
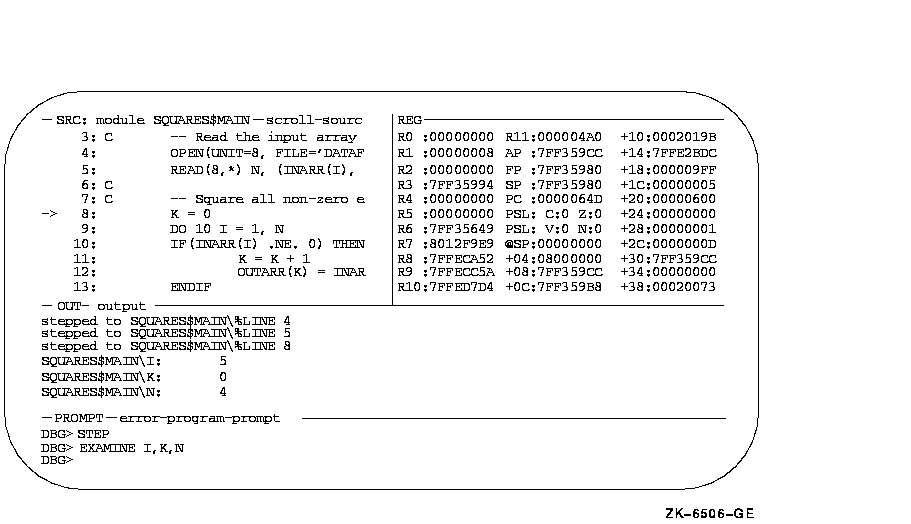
On VAX processors, predefined displays REG and IREG contain:
Note that displays REG and IREG do not display the vector registers. To display data contained in vector registers or vector control registers in screen mode, use a DO display (see Section 7.2.1).
See Figure 7-4 for an example of the predefined REG display.
Figure 7-4 Screen Mode Register Display

On Alpha processors, the predefined display REG contains:
On Alpha processors predefined display IREG contains, in hexadecimal format:
On VAX systems, predefined display IREG contains the same information as predefined display REG. |
On Alpha processors, the predefined display FREG contains:
The register values displayed are for the routine in which execution is currently paused. The values are updated whenever the debugger takes control. Any changed values are highlighted.
REG, IREG, and FREG (Alpha only) are initially marked as removed from the display pasteboard and are not visible. You must use the DISPLAY command to show the REG, IREG, or FREG displays. You can also press PF1 KP7 to show the REG display. Pressing PF1 KP7 enables you to place REG next to display INST.
If the register window is made larger, the debugger fills the remaining
space with information contained in the user call stack.
7.4.5.1 Displaying Register Values for a Routine on the Call Stack
The SET SCOPE/CURRENT command lets you display the register values associated with any routine that is currently on the call stack. For example, the following command updates display REG so that it shows the register values for the caller of the routine in which execution is currently paused:
DBG> SET SCOPE/CURRENT 1 |
To reset the default scope for displaying register values, enter the
CANCEL SCOPE command. This command causes display REG to show the
register values for the routine at the top of the call stack, where
execution is paused.
7.5 Manipulating Existing Displays
This section explains how to perform the following functions:
Section 7.7 and Section 7.2 discuss more advanced techniques for
modifying existing displays with the DISPLAY command---how to change
the display window and the type of information displayed.
7.5.1 Scrolling a Display
A display usually has more lines of text (and possibly longer lines) than can be seen through its window. The SCROLL command lets you view text that is hidden beyond a window's border. You can scroll through all displays except for the PROMPT display.
The easiest way to scroll displays is with the keypad keys, described later in this section. Using the relevant commands is explained first.
You can specify a display explicitly with the SCROLL command. Typically, however, you first use the SELECT/SCROLL command to select the current scrolling display. This display then has the scroll attribute and is the default display for the SCROLL command. You then use the SCROLL command with no parameter to scroll that display up or down by a specified number of lines, or to the right or left by a specified number of columns. The direction and distance scrolled are specified with the command qualifiers (/UP:n, /RIGHT:n, and so on).
In the following example, the SELECT command selects display OUT as the current scrolling display (/SCROLL can be omitted because it is the default qualifier); the SCROLL command then scrolls OUT to reveal text 18 lines down:
DBG> SELECT OUT DBG> SCROLL/DOWN:18 |
Several useful SELECT and SCROLL command lines are assigned to keypad keys (See Appendix A for a keypad diagram):
| Previous | Next | Contents | Index |
![[Site home]](../../images/buttons/bn_site_home_off.gif)
![[Send comments]](../../images/buttons/bn_comments_off.gif)
![[Help with this site]](../../images/buttons/bn_site_help_off.gif)
![[How to order documentation]](../../images/buttons/bn_order_docs_off.gif)
![[OpenVMS site]](../../images/buttons/bn_openvms_off.gif)
![[Compaq site]](../../images/buttons/bn_compaq_off.gif)
|
![[OpenVMS documentation]](../../images/openvms_doc_banner_bottom.gif) |
|
Copyright © Compaq Computer Corporation 1998. All rights reserved. Legal |
4538PRO_015.HTML
|