                         .
                         .
                         .
/***** Handle events *****/
static void doHandleEvents( )
{
    XEvent event;

    for ( ; ; ) {
        XNextEvent(dpy, &event);
        switch (event.type) {
            case Expose:                doExpose(&event); break;
            case ButtonPress:           doButtonPress(&event); break;
        }
    }
}

/***** Write a message *****/
(1)static void doExpose(eventP)
XEvent *eventP;
{
    char message1 [ ] = {"To draw multiple rectangles, click MB1"};
    char message2 [ ] = {"To exit, click MB2"};

    XDrawImageString(dpy, win, gc, 150, 25, message1, strlen(message1));
    XDrawImageString(dpy, win, gc, 150, 50, message2, strlen(message2));
}


/***** Draw the rectangles  *****/
static void doButtonPress(eventP)
XEvent *eventP;
{
#define REC_CNT 40
#define STEP 15
    XRectangle rec_arr[REC_CNT];
    int i;
(2)  if (eventP->xbutton.button == Button2) sys$exit (1);

    for (i=0;i<REC_CNT;i++) {
        rec_arr[i].x = STEP * i;
        rec_arr[i].y = STEP * i;
        rec_arr[i].width = STEP*2;
        rec_arr[i].height = STEP*3;
    }

(3)   XDrawRectangles(dpy, win, gc, &rec_arr, REC_CNT);
}
|
- When the client receives notification that the server has mapped the window, the doExpose routine writes two messages into the window. For information about using the DRAW IMAGE STRING routine, see Chapter 8.
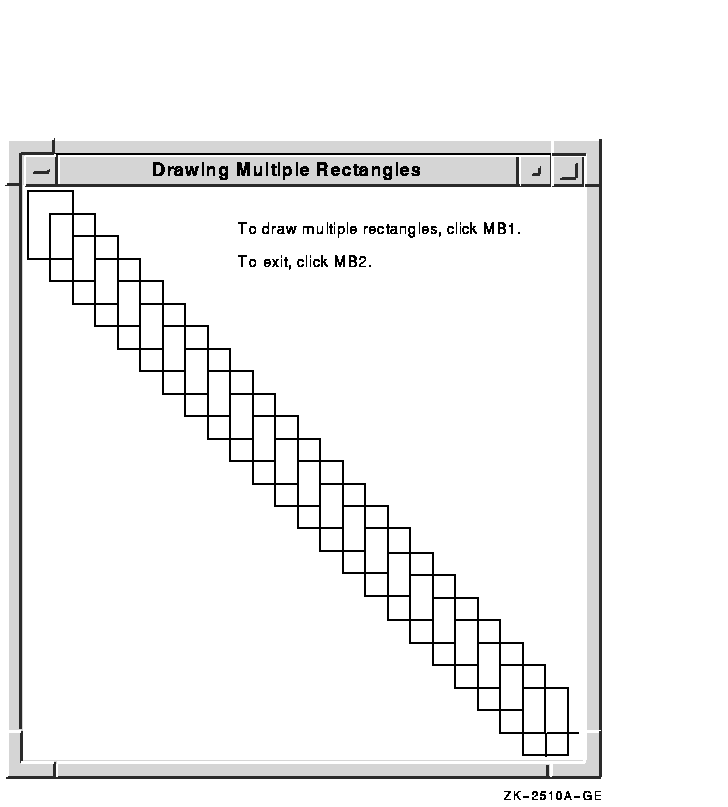
- If the user clicks any mouse button, the client calls the doButtonPress routine. If the user clicks MB1, the client draws rectangles defined in the initialization loop. If the user clicks MB2, the client exits the system. The client determines which button the user has clicked by referring to the button member of the button event data structure. For more information about the button event data structure, see Chapter 9.
- The DRAW RECTANGLE routine has the following
format:
XDrawRectangles(display, drawable_id, gc_id, rectangles,
num_rectangles)
Figure 6-5 Rectangles Drawn Using the DRAW RECTANGLES Routine
6.4.2 Drawing Arcs
Xlib routines enable clients to draw either single or multiple arcs. To draw a single arc, use the DRAW ARC routine, specifying a rectangle that defines the boundaries of the arc and two angles that determine the start and extent of the arc, as in the following:
int x=50
int y=100;
int width=25;
int length=50;
int angle1=5760;
int angle2=5760;
                    .
                    .
                    .
XDrawArc(display, window, gc, x, y, width, height,
     angle1, angle2);
|
The server draws an arc within a rectangle. The client specifies the upper left corner of the rectangle, relative to the origin of the drawable. The center of the rectangle is the center of the arc. The width and height of the rectangle are the major and minor axes of the arc, respectively.
Two angles specify the start and extent of the arc. The angles are signed integers in degrees scaled up by 64. For example, a client would specify a 90-degree arc as 64*90 or 5760 . The start of the arc is specified by the first angle, relative to the three o'clock position from the center of the rectangle. The extent of the arc is specified by the second angle, relative to the start of the arc. Positive integers indicate counterclockwise motion; negative integers indicate clockwise motion.
To draw multiple arcs, use the following method:
- Define an array of arc data structures.
- Call the DRAW ARCS routine, specifying the array that defines the arcs and the number of array elements.
The following illustrates the arc data structure:
typedef struct {
    short x, y;
    unsigned short width, height;
    short angle1, angle2;
} XArc;
|
Table 6-4 describes the members of the arc data structure.
| Member Name | Contents |
|---|---|
| x | Defines the x-coordinate value of the rectangle in which the server draws the arc |
| y | Defines the y-coordinate value of the rectangle in which the server draws the arc |
| width | Defines the major axis of the arc |
| height | Defines the minor axis of the arc |
| angle1 | Defines the starting point of the arc relative to the 3-o'clock position from the center of the rectangle |
| angle2 | Defines the extent of the arc relative to the starting point |
When drawing either single or multiple arcs, the server refers to the following members of the GC data structure to define arc characteristics:
| Function | Plane mask |
| Foreground | Background |
| Line width | Line style |
| Join style | Cap style |
| Fill style | Tile |
| Tile/stipple x origin | Tile/stipple y origin |
| Clip x origin | Clip y origin |
| Clip mask | Dash offset |
| Dashes | Stipple |
| Subwindow mode |
Chapter 4 describes the GC data structure members.
If the last point in one arc coincides with the first point in the following arc, the two arcs join. If the first point in the first arc coincides with the last point in the last arc, the two arcs join.
If two arcs join, the line width is greater than zero, and the arcs intersect, the server draws all pixels only once. Otherwise, it may draw intersecting pixels multiple times.
Example 6-4 illustrates using the DRAW ARCS routine.
| Example 6-4 Drawing Multiple Arcs |
|---|
                         .
                         .
                         .
/***** Handle events *****/
static void doHandleEvents( )
{
    XEvent event;

    for ( ; ; ) {
        XNextEvent(dpy, &event);
        switch (event.type) {
            case Expose:                doExpose(&event); break;
            case ButtonPress:           doButtonPress(&event); break;
        }
    }
}

/***** Write a message *****/
static void doExpose(eventP)
XEvent *eventP;
{
    char message1[ ] = {"To create arcs, click MB1"};
    char message2[ ] = {"Each click creates a new circle of arcs."};
    char message3[ ] = {"To exit, click MB2"};

    XDrawImageString(dpy, win, gc, 150, 25, message1, strlen(message1));
    XDrawImageString(dpy, win, gc, 150, 50, message2, strlen(message2));
    XDrawImageString(dpy, win, gc, 150, 75, message3, strlen(message3));
}


/***** Draw the arcs *****/
static void doButtonPress(eventP)
XEvent *eventP;
{
#define ARC_CNT 16
#define RADIUS 50
#define INNER_RADIUS  20
    XArc arc_arr[ARC_CNT];
    int i;
(1)  int x = eventP->xbutton.x;
    int y = eventP->xbutton.y;

    if (eventP->xbutton.button == Button2) sys$exit (1);

    for (i=0;i<ARC_CNT;i++) {
        arc_arr[i].angle1 = (64*360)/ARC_CNT * i;
        arc_arr[i].angle2 = (64*360)/ARC_CNT*3;
        arc_arr[i].width = RADIUS*2;
        arc_arr[i].height = RADIUS*2;
        arc_arr[i].x = x - RADIUS + sin(2*3.14159/ARC_CNT*i) * INNER_RADIUS;
        arc_arr[i].y = y - RADIUS + cos(2*3.14159/ARC_CNT*i) * INNER_RADIUS;
    }

(2)  XDrawArcs(dpy, win, gc, &arc_arr, ARC_CNT);
}
|
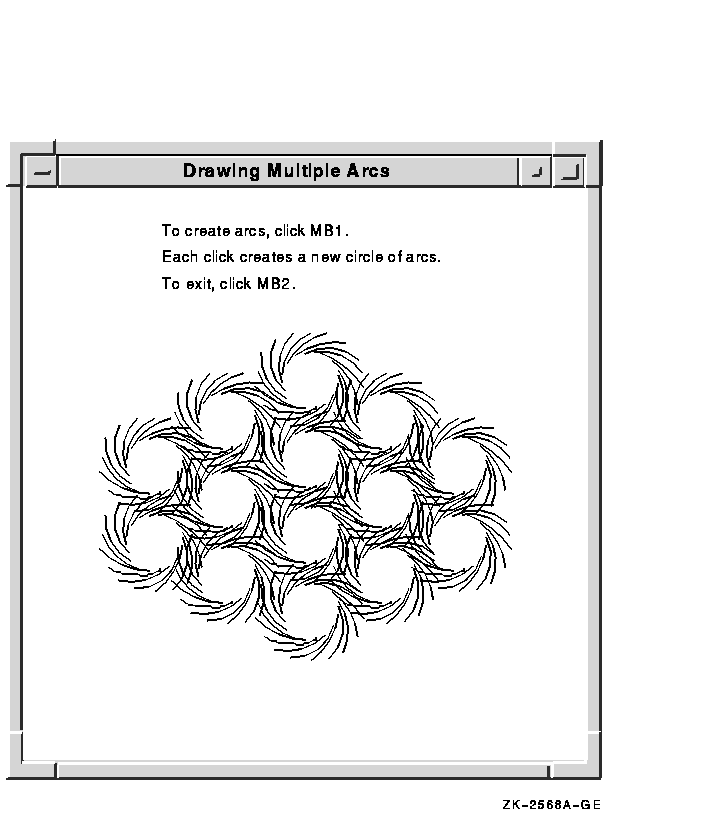
- The x and y variables specify the upper left corner of the rectangle that defines the boundary of the arc. The client determines the rectangle coordinates by taking the values of the x and y arguments from the button event data structure. Because these values indicate the position of the cursor when the user clicks the mouse button, the server draws the arcs relative to the position of the cursor. For more information about the button event data structure, see Chapter 9.
- The DRAW ARCS routine has the following
format:
XDrawArcs(display,drawable_id,gc_id,arcs,num_arcs)
Figure 6-6 illustrates the resulting output.
Figure 6-6 Multiple Arcs Drawn Using the DRAW ARCS Routine
6.5 Filling Areas
This section describes using Xlib routines to fill single rectangles,
arcs, and polygons, and multiple rectangles and arcs.
6.5.1 Filling Rectangles and Arcs
The FILL RECTANGLE, FILL RECTANGLES, FILL ARC, and FILL ARCS routines create single and multiple rectangles or arcs and fill them using the fill style that the client specifies in a graphics context data structure.
The method of calling the fill routines is identical to that for drawing rectangles and arcs. For example, to create rectangles filled solidly with foreground color in Example 6-3, the client needs only to call the FILL RECTANGLES routine instead of DRAW RECTANGLES. The default value of the GC data structure fill style member is solid. If the client were to specify a tile or stipple for filling the rectangles, the client would have to change the graphics context used by the FILL RECTANGLES routine.
The server refers to the following members of the GC data structure to define characteristics of the rectangles and arcs it fills:
| Function | Plane mask |
| Foreground | Background |
| Fill style | Tile |
| Stipple | Subwindow mode |
| Tile/stipple x origin | Tile/stipple y origin |
| Clip x origin | Clip y origin |
| Clip mask |
Additionally, the server refers to the arc mode member if filling arcs.
For information about using graphics context, see Chapter 4.
6.5.2 Filling a Polygon
To fill a polygon, use the following method:
- Define an array of point data structures.
- Call the FILL POLYGON routine, specifying the array that defines the points of the polygon, the number of points the server is to draw, the shape of the polygon, and the coordinate system the server is to use. The server draws the points in the order specified by the array.
See Section 6.3.1 for an illustration of the point data structure.
To improve performance, clients can specify whether the shape of the polygon is complex, convex, or nonconvex, as follows:
- Specify the constant Complex as the shape argument if the path that draws the polygon may intersect itself.
- Specify the constant Convex as the shape argument if the path that draws the shape is wholly convex. If a client specifies Convex for a path that is not convex, the results are undefined.
- Specify the constant Nonconvex as the shape argument if the path does not intersect itself, but the shape is not wholly convex. If a client specifies Nonconvex for a path that intersects itself, the results are undefined.
When filling the polygon, the server draws each pixel only once.
The server determines the location of points as follows:
- If the client specifies the constant CoordModeOrigin, the server defines all points in the array relative to the origin of the drawable.
- If the client specifies the constant CoordModePrevious, the server defines the coordinates of the first point in the array relative to the origin of the drawable, and the coordinates of each subsequent point relative to the point preceding it in the array.
If the last point does not coincide with the first point, the server closes the polygon automatically.
The server refers to the following members of the GC data structure to define the characteristics of the polygon it fills:
| Function | Plane mask |
| Foreground | Fill style |
| Fill rule (if polygon is complex) | Tile |
| Tile/stipple x origin | Tile/stipple y origin |
| Clip x origin | Clip y origin |
| Subwindow mode | Clip mask |
| Stipple | Background |
Chapter 4 describes GC data structure members.
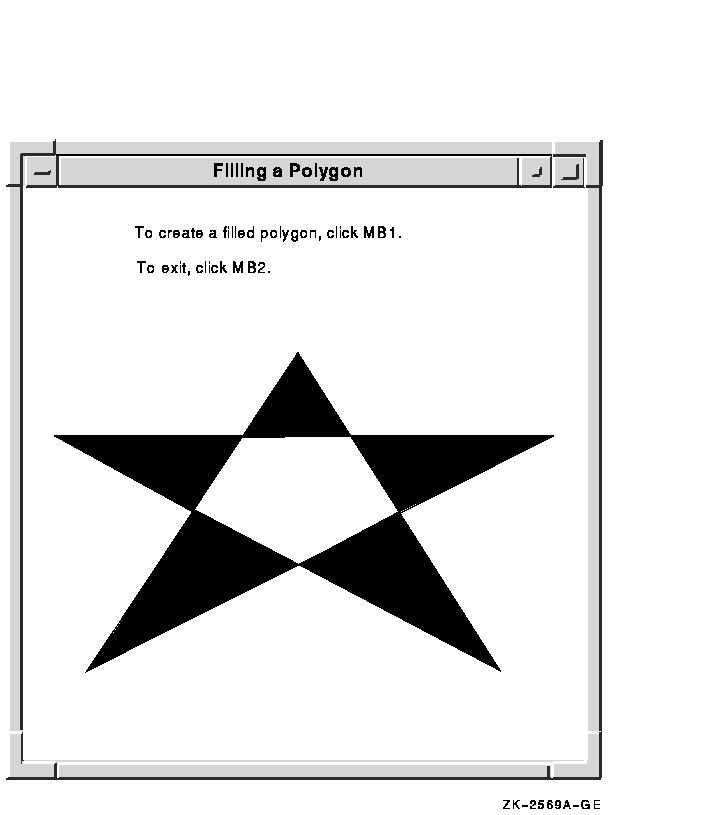
Example 6-5 uses the FILL POLYGON routine to draw and fill the star created in Example 6-2.
| Example 6-5 Filling a Polygon |
|---|
                         .
                         .
                         .
/***** Handle events *****/
static void doHandleEvents( )
{
    XEvent event;

    for ( ; ; ) {
        XNextEvent(dpy, &event);
        switch (event.type) {
            case Expose:                doExpose(&event); break;
        }
    }
}
/***** Expose event ****/
static void doExpose(eventP)
XEvent *eventP;
{
    XPoint pt_arr[6];

(1)  pt_arr[0].x = 75;
    pt_arr[0].y = 500;
    pt_arr[1].x = 300;
    pt_arr[1].y = 100;
    pt_arr[2].x = 525;
    pt_arr[2].y = 500;
    pt_arr[3].x = 50;
    pt_arr[3].y = 225;
    pt_arr[4].x = 575;
    pt_arr[4].y = 225;
    pt_arr[5].x = 75;
    pt_arr[5].y = 500;

(2)   XFillPolygon(dpy, win, gc, &pt_arr, 6, Complex, CoordModeOrigin);
}
                         .
                         .
                         .
|
- Use an array of point data structures to specify the points that define the polygon.
- The call to fill the polygon refers to a graphics context (gc), which the client has previously defined, and an array of point data structures. The constant Complex indicates that the path of the line that draws the polygon intersects itself. The constant CoordModeOrigin indicates that all points are relative to the origin of win (100,100).
Figure 6-7 illustrates the resulting output.
Figure 6-7 Filled Star Created Using the FILL POLYGON Routine
6.6 Clearing and Copying Areas
Xlib includes routines that enable clients to clear or copy a specified area of a drawable. Because pixmaps do not have defined backgrounds, clients clearing an area of a pixmap must use the FILL RECTANGLE routine described in Section 6.5.1. For more information about pixmaps, see Chapter 7.
This section describes how to clear windows and copy areas of windows
and pixmaps.
6.6.1 Clearing Window Areas
To clear an area of a window, use the CLEAR AREA or CLEAR WINDOW routine. The CLEAR AREA routine clears a specified area and generates an expose event, if the client directs the server to do so.
The CLEAR WINDOW routine clears the entire area of the specified window. If the window has a defined background tile, the window is retiled. If the window has no defined background, the server does not change the window contents.
Example 6-6 illustrates clearing a window.
| Example 6-6 Clearing a Window |
|---|
                    .
                    .
                    .
/***** Draw multiple arcs  *****/
static void doButtonPress(eventP)
XEvent *eventP;
{
#define ARC_CNT 16
#define RADIUS 50
#define INNER_RADIUS  20
    XArc arc_arr[ARC_CNT];
    int i;
    int x = eventP->xbutton.x;
    int y = eventP->xbutton.y;

    if (eventP->xbutton.button == Button2) sys$exit (1);
    if (eventP->xbutton.button == Button3)
    {
        XClearWindow(dpy, win);
        return;
    }

    for (i=0;i<ARC_CNT;i++) {
        arc_arr[i].angle1 = (64*360)/ARC_CNT * i;
        arc_arr[i].angle2 = (64*360)/ARC_CNT*3;
        arc_arr[i].width = RADIUS*2;
        arc_arr[i].height = RADIUS*2;
        arc_arr[i].x = x - RADIUS + sin(2*3.14159/ARC_CNT*i) * INNER_RADIUS;
        arc_arr[i].y = y - RADIUS + cos(2*3.14159/ARC_CNT*i) * INNER_RADIUS;
    }

    XDrawArcs(dpy, win, gc, &arc_arr, ARC_CNT);
}
|
The example modifies the doButtonPress routine of Example 6-4 to clear the window when the user clicks MB3.
To clear multiple areas, using the FILL RECTANGLES routine is faster than using the CLEAR WINDOW or CLEAR AREA routine. To clear multiple areas on a monochrome screen, first set the function member of the GC data structure to the value specified by the constant GXclear. Then call the FILL RECTANGLES routine. If the screen is a color type, set the value of the background to the background of the window before calling FILL RECTANGLES.
| Previous | Next | Contents | Index |
