![[OpenVMS documentation]](../../images/openvms_doc_banner_top.gif)
|
![[Site home]](../../images/buttons/bn_site_home_off.gif)
![[Send comments]](../../images/buttons/bn_comments_off.gif)
![[Help with this site]](../../images/buttons/bn_site_help_off.gif)
![[How to order documentation]](../../images/buttons/bn_order_docs_off.gif)
![[OpenVMS site]](../../images/buttons/bn_openvms_off.gif)
![[Compaq site]](../../images/buttons/bn_compaq_off.gif)
|
| Updated: 11 December 1998 |
|
|
|
|
| Updated: 11 December 1998 |
OpenVMS Debugger Manual
| Previous | Contents | Index |
You can enable country-specific features for screen mode by defining logical names, as follows:
$ DEFINE/JOB DBG$SMGSHR <name_of_Asian_SMG> |
This part describes the debugger's DECwindows Motif interface.
For information about the debugger's command interface, see Part 2.
This chapter introduces the debugger's DECwindows Motif interface. For information about the command interface, see Part 2.
The DECwindows Motif interface to the OpenVMS Debugger Version 7.1 or later requires Version 1.2 or later of DECwindows Motif. |
This chapter provides the following information:
For information about starting a debugging session, see Chapter 9.
For detailed information about using the Motif interface for debugging,
see Chapter 10. For the source code of program EIGHTQUEENS.EXE,
shown in the figures of this chapter, see Appendix D.
8.1 Introduction
The OpenVMS Debugger has a DECwindows Motif graphical user interface (GUI) for workstations. This enhancement to the screen-mode command interface accepts mouse input to choose items from menus and to activate or deactivate push buttons, to drag the pointer to select text in windows, and so on. The debugger's DECwindows Motif GUI menus and push buttons provide the functions for most basic debugging tasks.
The DECwindows Motif GUI is layered on the character-cell command interface and has a command-entry prompt on the command line (in the command view). From the DECwindows Motif GUI command line, you can enter debugger commands for the following purposes:
You can customize the DECwindows Motif GUI to associate other debugger commands with new or existing push buttons.
You can run the DECwindows Motif GUI in local mode or in client/server mode. Client/server mode allows you to debug programs remotely from another OpenVMS node. The user interface in both Motif modes is virtually identical. Chapter 9 describes how to start interfaces.
The DECwindows Motif GUI does not recognize the HELP command at its command-entry prompt. Choose the On Commands item in the Help menu for online help on debugger commands. You cannot use the DECwindows Motif GUI to debug detached processes such as print symbionts that run without a command line interpreter (CLI). See Section 1.12 for details about debugging detached processes that do not have a CLI. |
The following paragraphs highlight some of the convenience features of the debugger's default DECwindows Motif interface. Section 8.2 gives visual details. (Convenience features of the debugger's command interface are described in detail in Section 1.1.2.)
The OpenVMS Debugger is a source-level debugger. The debugger displays in the source view the source code that surrounds the instruction where program execution is paused currently. You can enable and disable the display of compiler-generated line numbers.
A source browser lets you:
The call-stack menu on the main window lists the sequence of routine calls currently on the call stack. Click on a routine name in the call-stack menu to set (to that routine) the context (scope) for
You set, activate, and deactivate breakpoints by clicking on buttons next to the source lines in the source view or the instruction view. Optionally, you can set, deactivate, or activate breakpoints by selecting items in window pull-down menus, pop-up menus, context-sensitive menus, or dialog boxes. You can set conditional breakpoints, which suspend program execution if the specified condition is true. You can set action breakpoints, which execute one or more debugger commands when the breakpoint suspends program execution. The main window push buttons, the instruction view push buttons, and the breakpoint view give a visual indication of activated, deactivated, and conditional breakpoints.
Push buttons in the push button view control common operations: by clicking on a push button, you can start execution, step to the next source line, display the value of a variable selected in a window, interrupt execution, and so on.
You can modify, add, remove, and resequence push buttons and the associated debugger commands.
Context-Sensitive Pop-Up Menus
Context-sensitive pop-up menus list common operations associated with your view (source view, command view, and so on.) When you click MB3, the pop-up menu lists actions for the text you have selected, the source line at which you are pointing, or the view in which you are working.
Displaying and Manipulating Data
To display the value of a variable or expression, select the variable or expression in the source view and click on a push button, such as EVAL (evaluate expression) or EX (examine variable). You can also display selected values by choosing items from window pull-down menus (such as Examine, in the Commands pull-down menu), context-sensitive menus, or dialog boxes. You can display values in different type or radix formats.
To change the value of a variable, edit the currently displayed value in the monitor view. You can also change values by selecting items in window pull-down menus (such as Deposit, in the Commands pull-down menu), context-sensitive pop-up menus, or dialog boxes.
The monitor view displays the updated values of specified variables whenever the debugger regains control from your program.
You can run the debugger in a state known as the kept debugger from which you can rerun the same program or run another program without exiting the debugger. When rerunning a program, you can choose to save the current state of breakpoints, tracepoints, and static watchpoints. The kept debugger is also available in the screen mode debugger. See Section 9.1 for information on starting the kept debugger.
You can run the debugger in a client/server configuration, which allows you to debug programs that run on an OpenVMS node remotely from another OpenVMS node using the DECwindows Motif interface, or from a PC using the Microsoft Windows interface. Up to 31 debug clients can simultaneously access the same debug server, which allows many debugging options.
Instruction and Register Views
The instruction view shows the decoded instruction stream (the code that is actually executing) of your program. This view is useful if the program you are debugging has been optimized by the compiler, in which case the source code in the source view may not reflect the code that is executing. You can set breakpoints on instructions and display the memory addresses and source-code line numbers associated with each instruction.
The register view displays the current contents of all machine registers. You can edit the displayed values to deposit other values into the registers.
The debugger has a status indicator to identify the state of the debugger, which can be one of the following:
The tasking view displays information about the current state of all tasks of a tasking program (also called a multithread program). You can modify task characteristics to control task execution, priority, state transitions, and so on.
Integration with Command Interface
The debugger's DECwindows Motif GUI is an enhancement to the character-cell debugger. It is layered on, and closely integrated with, the command-driven character-cell debugger:
Integration with Source-Level Editor
You can edit program source code without exiting from the debugger. In the editor view, you can display the source code, search and replace text, or add additional text. Editor view text buffers allow you to move quickly back and forth between new or existing files, and copy, cut, and paste text from buffer to buffer.
The text editor available through the debugger's DECwindows Motif menu interface is a simple convenience feature, not intended to replace sophisticated text editors such as the Language-Sensitive Editor (LSE). To use a different editor, enter the Edit command at the DBG> prompt in the command view (see the EDIT command).
You can modify the following and other aspects of the debugger's DECwindows Motif interface and save the current settings in a resource file to customize your debugger startup environment:
Online help is available for the debugger's DECwindows Motif interface
(context-sensitive help) and for its command interface.
8.2 Debugger Windows and Menus
The following sections describe the debugger windows, menus, views, and
other features of the OpenVMS Debugger DECwindows Motif interface.
8.2.1 Default Window Configuration
By default, the debugger starts up in the main window, as shown in Figure 8-1.
When you start the debugger as explained in Section 9.1, the source view is initially empty. Figure 8-1 shows the source view after a program has been brought under debugger control (by directing the debugger to run a specific image, in this example, EIGHTQUEENS).
You can customize the startup configuration to your preference as described in Section 10.10.1.
Figure 8-1 Default Window Configuration
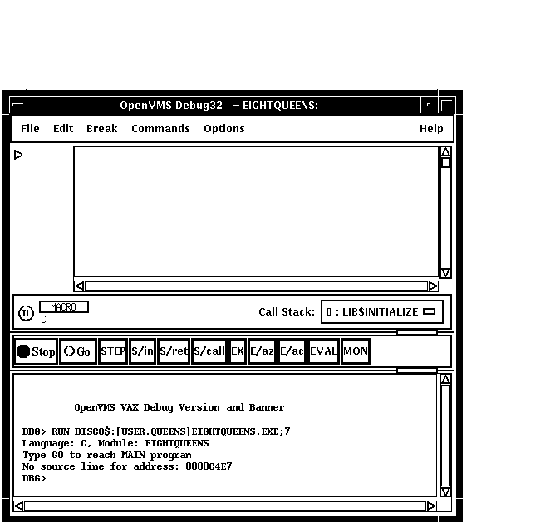
The main window (see Figure 8-1) includes:
If the debugger is running on a VAX processor, the name of the debugger
is "OpenVMS Debug32." If the debugger is running on an Alpha processor,
the name of the debugger is "OpenVMS Debug64."
8.2.2.1 Title Bar
The title bar, at the top of the main window, displays (by default) the
name of the debugger, the name of the program being debugged, and the
name of the source code module that is currently displayed in the
source view.
8.2.2.2 Source View
The source view shows the following:
For more information about displaying source code, see Section 8.2.2.3
and Section 10.1.
8.2.2.3 Menus on Main Window
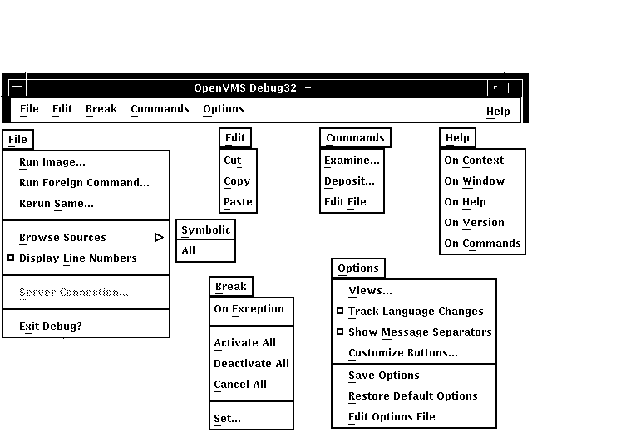
Figure 8-2 and Table 8-1 describe the menus on the main window.
Figure 8-2 Menus on Main Window
| Menu | Item | Description |
|---|---|---|
| File | Run Image... | Bring a program under debugger control by specifying an executable image. |
| Run Foreign Command... | Bring a program under debugger control by specifying a symbol for a foreign command. | |
| Rerun Same... | Rerun the same program under debugger control. | |
| Browse Sources |
Display the source code in any module of your program. Set breakpoints
on routines.
|
|
| Display Line Numbers | Display or hide line numbers in the source view. | |
| Server Connection... | (Client/Server mode) Specify the network binding string of the server for connection. | |
| Exit Debug? | End the debugging session, terminating the debugger. | |
| Edit | Cut | Cut selected text and copy it to the clipboard. You can cut text only from fields or regions that accept input (although, in most cases, Cut copies the selected text to the clipboard). |
| Copy | Copy selected text from the window to the clipboard without deleting the text. | |
| Paste | Paste text from the clipboard to a text-entry field or region. | |
| Break | On Exception | Break on any exception signaled during program execution. |
| Activate All | Activate any previously set breakpoints. | |
| Deactivate All | Deactivate any previously set breakpoints. | |
| Cancel All | Remove all breakpoints from the debugger's breakpoint list and from the breakpoint view. | |
| Set... | Set a new breakpoint, optionally associated with a particular condition or action, at a specified location. | |
| Commands | Examine... | Examine the current value of a variable or expression. The output value may be typecast or changed in radix. |
| Deposit... | Deposit a value to a variable. The input value may be changed in radix. | |
| Edit File | Edit the source code of your file in the debugger's editor. | |
| Options | Views... |
Display one or more of the following:
|
| Track Language Changes | Notify you if the debugger enters a module that is written in a language different from the previously executed module. | |
| Show Message Separators | Display a dotted line between each command and message displayed by the debugger. | |
| Customize Buttons... | Modify, add, remove, or resequence a push button in the push button view and the associated debugger command. | |
| Save Options | Save the current settings of all DECwindows Motif features of the debugger that you can customize interactively, such as the configuration of windows and views, and push button definitions. This preserves the current debugger configuration for the next time you run the debugger. | |
| Restore Default Options | Copy the system default debugger resource file DECW$SYSTEM_DEFAULTS:VMSDEBUG.DAT to the user-specific resource file DECW$USER_DEFAULTS:VMSDEBUG.DAT. The default options take effect when you next start the debugger. | |
| Edit Options File | Load and display the user-specific resource file DECW$USER_DEFAULTS:VMSDEBUG.DAT in the debug editor for review and modification. | |
| Help | On Context | Enable the display of context-sensitive online help. |
| On Window | Display information about the debugger. | |
| On Help | Display information about the online help system. | |
| On Version | Display information about this version of the debugger. | |
| On Commands | Display information about debugger commands. |
| Register Type | VAX Displays | Alpha Displays |
|---|---|---|
| Call Frame | AP, FP, SP, PC, PSL | R0, R25, R26, R27, FP, SP, F0, F1, PC, PS, FPCR, SFPCR |
| General Purpose | R0-R11 | R0-R28, FP, SP, R31 |
| Floating Point | n/a | F0-F31 |
The Call Stack menu, between the source view and the push button view,
shows the name of the routine whose source code is displayed in the
source view. This menu lists the sequence of routine calls currently on
the stack and lets you set the scope of source code display and symbol
searches to any routine on the stack (see Section 10.6.2).
8.2.2.5 Push Button View
Figure 8-3 and Table 8-3 describe the default push buttons in the main window. You can modify, add, remove, and resequence buttons and their associated commands as explained in Section 10.10.3.
Figure 8-3 Default Buttons in the Push Button View

| Button | Description |
|---|---|
| Stop | Interrupt program execution or a debugger operation without ending the debugging session. |
| Go | Start or resume execution from the current program location. |
| STEP | Execute the program one step unit of execution. By default, this is one executable line of source code. |
| S/in | When execution is suspended at a routine call statement, move execution into the called routine just past the start of the routine. This is the same behavior as STEP if not at a routine call statement. |
| S/ret | Execute the program directly to the end of the current routine. |
| S/call | Execute the program directly to the next Call or Return instruction. |
| EX | Display, in the command view, the current value of a variable whose name you have selected in a window. |
| E/az | Display, in the command view, the current value of a variable whose name you have selected in a window. The variable is interpreted as a zero-terminated ASCII string. |
| E/ac | Display, in the command view, the current value of a variable whose name you have selected in a window. The variable is interpreted as a counted ASCII string preceded by a one-byte count field that contains the length of the string. |
| EVAL | Display, in the command view, the value of a language expression in the current language (by default, the language of the module containing the main program). |
| MON | Display, in the monitor view, a variable name that you have selected in a window and the current value of that variable. Whenever the debugger regains control from your program, it automatically checks the value and updates the displayed value accordingly. |
| Previous | Next | Contents | Index |
|
|
![[OpenVMS documentation]](../../images/openvms_doc_banner_bottom.gif) |
|
Copyright © Compaq Computer Corporation 1998. All rights reserved. Legal |
4538PRO_017.HTML
|