![[OpenVMS documentation]](../../images/openvms_doc_banner_top.gif)
|
![[Site home]](../../images/buttons/bn_site_home_off.gif)
![[Send comments]](../../images/buttons/bn_comments_off.gif)
![[Help with this site]](../../images/buttons/bn_site_help_off.gif)
![[How to order documentation]](../../images/buttons/bn_order_docs_off.gif)
![[OpenVMS site]](../../images/buttons/bn_openvms_off.gif)
![[Compaq site]](../../images/buttons/bn_compaq_off.gif)
|
| Updated: 11 December 1998 |
OpenVMS Debugger Manual
| Previous | Contents | Index |
The OpenVMS Debugger Version 7.2 features a client/server interface that allows you to debug programs running on OpenVMS on a VAX or Alpha CPU from a client interface running on the same or separate system.
The debugger client/server retains the functionality of the kept
debugger, but splits the debugger into two components: the debug server
and the debug client. The debug server runs on an OpenVMS system, and
is just like the kept debugger without the user interface. The debug
client contains the user interface, and runs on an OpenVMS system using
DECwindows Motif, or on a PC running Microsoft Windows 95 or Microsoft
Windows NT.
9.8.1 Software Requirements
The debug server requires OpenVMS Version 7.2 or later.
The debug client can run on any of the following:
The OpenVMS Debugger client/server configuration also requires that the following be installed on the OpenVMS node running the server:
If you are running TCP/IP Services for OpenVMS (UCX) Version 4.1, you must have ECO2 installed. You can also run a later version of UCX. The OpenVMS Version 7.2 installation procedures automatically install DCE RPC. |
You can start the debug server after logging in directly to the OpenVMS system, or you may find it more convenient to log in remotely with a product such as eXcursion, or an emulator such as Telnet.
To start the debug server, enter the following command:
$ DEBUG/SERVER |
The server displays its network binding strings. The server port number is enclosed in square brackets ([]). For example:
$ DEBUG/SERVER %DEBUG-I-SPEAK: TCP/IP: YES, DECnet: YES, UDP: YES %DEBUG-I-WATCH: Network Binding: ncacn_ip_tcp:16.32.16.138[1034] %DEBUG-I-WATCH: Network Binding: ncacn_dnet_nsp:19.10[RPC224002690001] %DEBUG-I-WATCH: Network Binding: ncadg_ip_udp:16.32.16.138[1045] %DEBUG-I-AWAIT: Ready for client connection... |
Use one of the network binding strings to identify this server when you connect from the client (see Section 9.8.4). The following table matches the network binding string prefix with its associated network transport:
| Network Transport | Network Binding String Prefix |
|---|---|
| TCP/IP | ncacn_ip_tcp |
| DECnet | ncacn_dnet_nsp |
| UDP | ncadg_ip_udp |
You can usually identify the server using only the node name and the port number. For example, nodnam[1034]. Messages and program output appear by default in the window in which you start the server. You can redirect program output to another window as required. |
The following example contains an error message that indicates that DCE is not installed:
$ debug/server %LIB-E-ACTIMAGE, error activating image disk:[SYSn.SYSCOMMON.][SYSLIB]DTSS$SHR.EXE; -RMS-E-FNF, file not found |
This indicates that DCE is installed but not configured.
9.8.3 Primary Clients and Secondary Clients
The debugger client/server interface allows more than one client to be connected to the same server. This allows team debugging, classroom sessions, and other applications.
The primary client is the first client to connect to the server. A secondary client is an additional client that has connected to the same server. The primary client controls whether or not any secondary clients can connect to the server.
Section 9.8.4 describes how to specify the number of secondary clients
allowed in a session.
9.8.4 Starting the Motif Client
A session is the connection between a particular client and a particular server. Each session is identified within the client by the network binding string the client used to connect to the server. Once the debug server is running, start the Motif debug client. To do so, enter the following command:
$ DEBUG/CLIENT |
To establish a session from the Motif debug client, click on Server Connection from the File menu. The Server Connection dialog displays, in the Connection list, the default network binding string. This string is based on the last string you entered, or the node on which the client is running. There is not necessarily a server associated with the default binding string. Figure 9-6 shows the Server Connection dialog.
Figure 9-6 Debug Server Connection Dialog
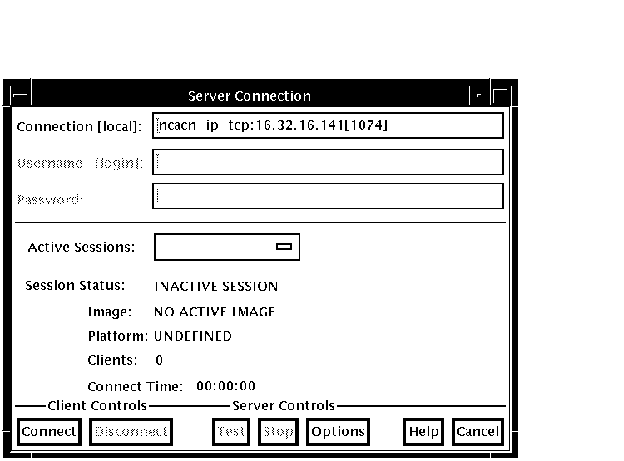
From the buttons at the bottom of the Server Connection dialog, you can
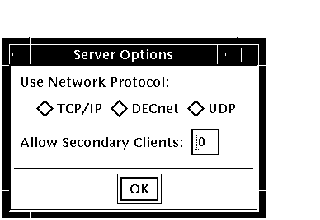
In addition, the Options button invokes the Server Options dialog, which allows you to select the network transport to be used (see Section 11.5.1).
The Server Options dialog also allows you to select the number of secondary clients (0-31) allowed for a new session.
Figure 9-7 shows the Server Options dialog.
Figure 9-7 Server Options Dialog
To connect the client to a server, perform the following steps:
You can establish connections to an unlimited number of servers by
repeating the sequence above and specifying the new network binding
string each time.
9.8.5 Switching Between Sessions
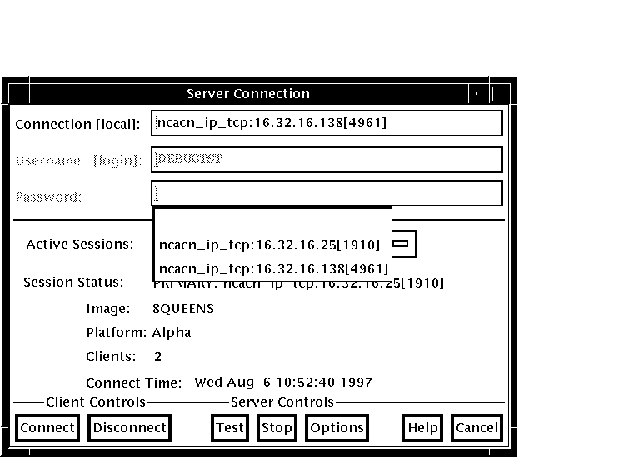
Each time you connect to a server and initiate a session, the session is listed in the Active Sessions list in the Server Connection dialog (see Figure 9-8). You can switch back and forth between sessions. Each time you switch to a new session, the debugger updates the contents of any open debugger displays with the new context.
To switch to a different session, perform the following steps:
Note that you cannot change the number of secondary clients allowed on a session while that session is active. To change the number of clients allowed on a session, you must be the primary client, and perform the following steps:
Figure 9-8 Active Sessions List
Click on Exit Debug? on the File menu to invoke the Confirm Exit dialog. Figure 9-9 shows the Confirm Exit dialog.
Figure 9-9 Confirm Exit Dialog
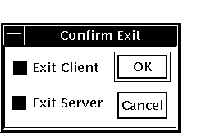
Once you have invoked the Confirm Exit dialog, perform one of the following:
If you do not terminate the debug server, you can connect to the server from another debug client. If you do not terminate the client, you can connect to another server for which you know the network binding string.
This chapter explains how to:
The chapter describes window actions and window menu choices, but you can perform most common debugger operations by choosing items from context-sensitive pop-up menus. To access these menus, click MB3 while the mouse pointer is in the window area.
You can also enter commands at the DECwindows Motif command prompt. For information about entering debugger commands, see Section 8.3.
For the source code of programs EIGHTQUEENS.EXE and 8QUEENS.EXE, shown
in the figures of this chapter, see Appendix D.
10.1 Displaying the Source Code of Your Program
The debugger displays the source code of your program in the main window (see Figure 10-1).
Figure 10-1 Source Display
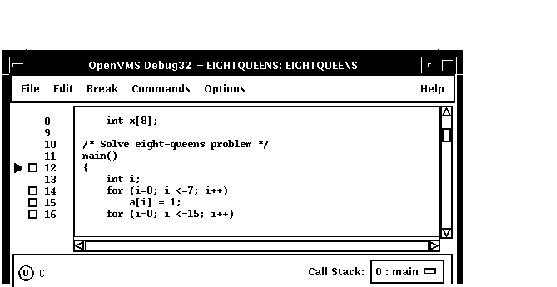
Whenever execution is suspended (for example, at a breakpoint), the debugger updates the source display by displaying the code surrounding the point at which execution is paused. The current-location pointer, to the left of the source code, marks which line of code will execute next. (A source line corresponds to one or more programming-language statements, depending on the language and coding style.)
By default, the debugger displays compiler-generated line numbers to the left of the source code. These numbers help identify breakpoints, which are listed in the breakpoint view (see Section 10.4.4). You can choose not to display line numbers so that more of the source code can show in the window. To hide or display line numbers, toggle Display Line Numbers from the File menu on the main window.
The Call Stack menu, between the source view and the push button view, shows the name of the routine whose source code is displayed.
The current-location pointer is normally filled in as shown in Figure 10-1. It is cleared if the displayed code is not that of the routine in which execution is paused (see Section 10.1.3 and Section 10.6.2).
You can use the scroll bars to show more of the source code. However, you can scroll vertically through only one module of your program at a time. (A module corresponds generally to a compilation unit. With many programming languages, a module corresponds to the contents of a source file. With some languages, such as Ada, a source file might contain one or more modules.)
The following sections explain how to display source code for other parts of your program so that you can set breakpoints in various modules, and so on. Section 10.1.3 explains what to do if the debugger cannot find source code for display. Section 10.6.2 explains how to display the source code associated with routines that are currently active on the call stack.
After navigating the main window, you can redisplay the location at which execution is paused by clicking on the Call Stack menu.
If your program was optimized during compilation, the source code
displayed might not reflect the actual contents of some program
locations
(see Section 1.2).
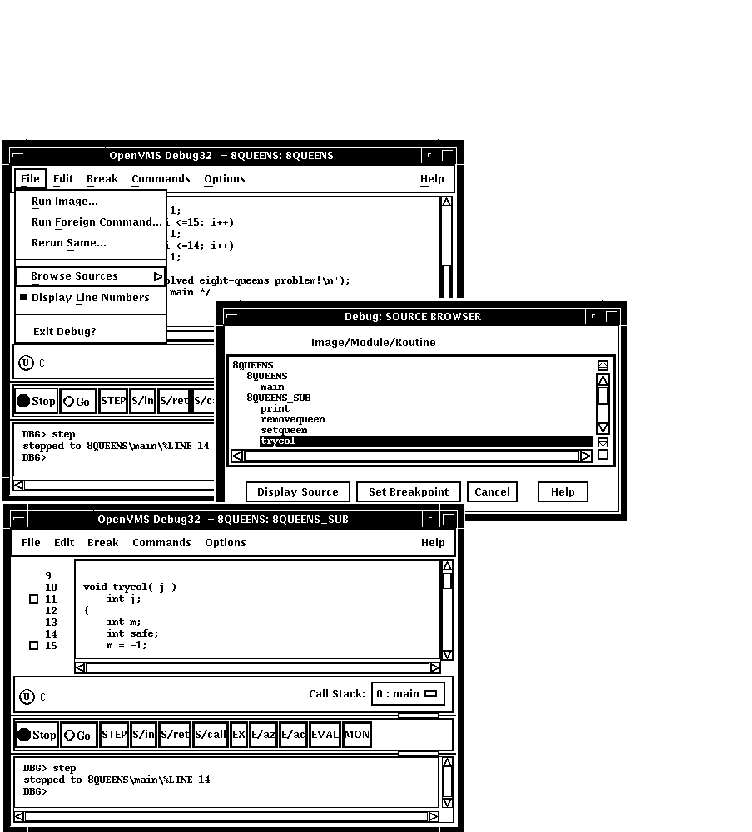
10.1.1 Displaying the Source Code of Another Routine
To display source code of another routine:
Section 10.6.2 describes an alternative way to display routine source code for routines currently active on the call stack.
Figure 10-2 Displaying Source Code of Another Routine
10.1.2 Displaying the Source Code of Another Module
To display source code of another module:
In certain cases, the debugger cannot display source code. Possible causes are:
If the debugger cannot find source code for display, it tries to
display the source code for the next routine down on the call stack for
which source code is available. If the debugger can display source code
for such a routine, the current-location pointer is cleared and marks
the source line to which execution returns in the calling routine.
10.1.4 Specifying the Location of Source Files
Information about the characteristics and the location of source files
is embedded in the debug symbol table of your program. If a source file
has been moved to a different directory since compile time, the
debugger might not find the file. To direct the debugger to your source
files, use the SET SOURCE command at the DBG> prompt (see
Section 6.2).
10.2 Editing Your Program
The debugger provides a simple text editor you can use to edit your source files while debugging your program (see Figure 10-3).
The text editor available through the debugger's DECwindows Motif menu interface is a simple convenience feature, not intended to replace sophisticated text editors such as the Language-Sensitive Editor (LSE). You cannot substitute a more sophisticated editor for the text editor invoked with the Edit File item in the Commands menu. To use a different editor, enter the EDIT command at the DBG> prompt in the command view (see EDIT in the Command Reference Dictionary of this manual).
Figure 10-3 Editor Window
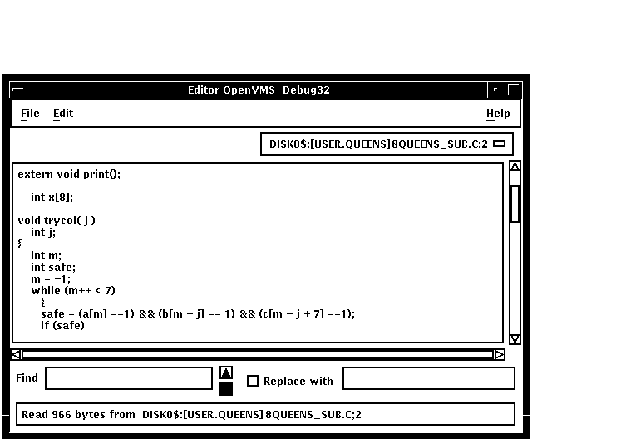
To invoke the editor, choose the Edit File item in the Commands menu on the main window. By default, the editor opens a buffer and displays the module currently displayed in the source view. The buffer is named with the file specification of the file in the buffer. If no file is displayed in the source view, the editor displays an empty text buffer, called main_buffer. The buffer name appears in the buffer menu, which is just under the menu bar of the editor view.
The editor allows you to create any number of text buffers by choosing New (for empty text buffers) or Open (for existing files) from the File menu. The name of each text buffer appears in the buffer menu. You can cut, copy, and paste text from buffer to buffer by choosing items from the Edit menu and selecting buffers from the buffer menu.
You can perform forward and backward search and replace operations by entering strings in the Find and Replace with fields and clicking on a directional arrow. You can perform a repeated search for the string by continuing to press the Return key. You can also continue a search by choosing the Find/Replace Next or Find/Replace Previous items in the Edit menu.
To save the file, choose the Save or Save As... items from the File menu. If you do not save your corrections before closing a modified buffer or exiting the debugger, the debugger displays a warning message.
To test any changes to the source code:
This section explains how to:
For information about rerunning your program or running another program
from the current debugging session, see Section 9.3 and Section 9.4.
10.3.1 Determining Where Execution Is Currently Paused
To determine where execution is currently paused within your program:
To list the sequence of routine calls that are currently active on the
call stack, click on the Call Stack menu. Level 0 denotes the routine
in which execution is paused, level 1 denotes the calling routine, and
so on.
10.3.2 Starting or Resuming Program Execution
To start program execution or resume execution from the current location, click on the Go button in the push button view (see Figure 8-3).
Letting your program run freely without debugger intervention is useful in situations such as the following:
Once started, program execution continues until one of the following events occurs:
Whenever the debugger suspends execution of the program, the main window display is updated and the current-location pointer marks which line of code will execute next.
| Previous | Next | Contents | Index |
![[Site home]](../../images/buttons/bn_site_home_off.gif)
![[Send comments]](../../images/buttons/bn_comments_off.gif)
![[Help with this site]](../../images/buttons/bn_site_help_off.gif)
![[How to order documentation]](../../images/buttons/bn_order_docs_off.gif)
![[OpenVMS site]](../../images/buttons/bn_openvms_off.gif)
![[Compaq site]](../../images/buttons/bn_compaq_off.gif)
|
![[OpenVMS documentation]](../../images/openvms_doc_banner_bottom.gif) |
|
Copyright © Compaq Computer Corporation 1998. All rights reserved. Legal |
4538PRO_020.HTML
|